Use of an Artificial Neural Network to Predict Thunderstorm Locations

CBI in collaboration with Waylon Collins, a senior forecaster at the Corpus Christi Weather Forecasting Office is developing a model to predict the timing and location of thunderstorms. The model was presented at several AMS conferences and work is ongoing to develop an operational prototype.
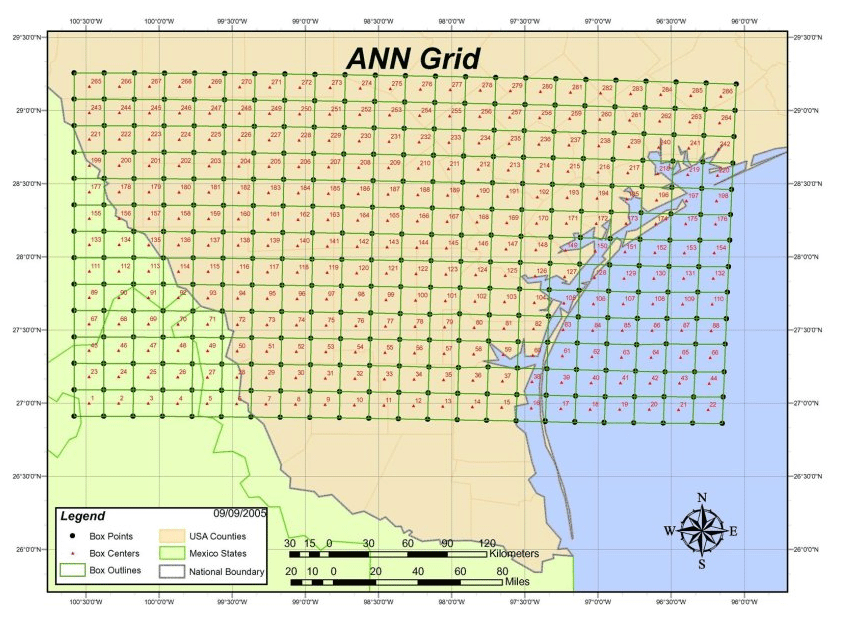
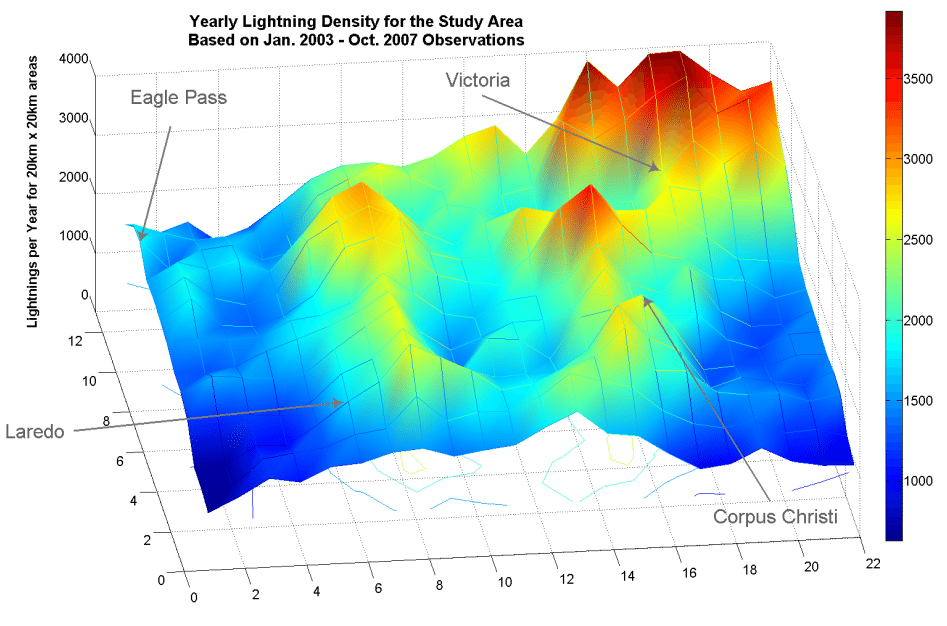
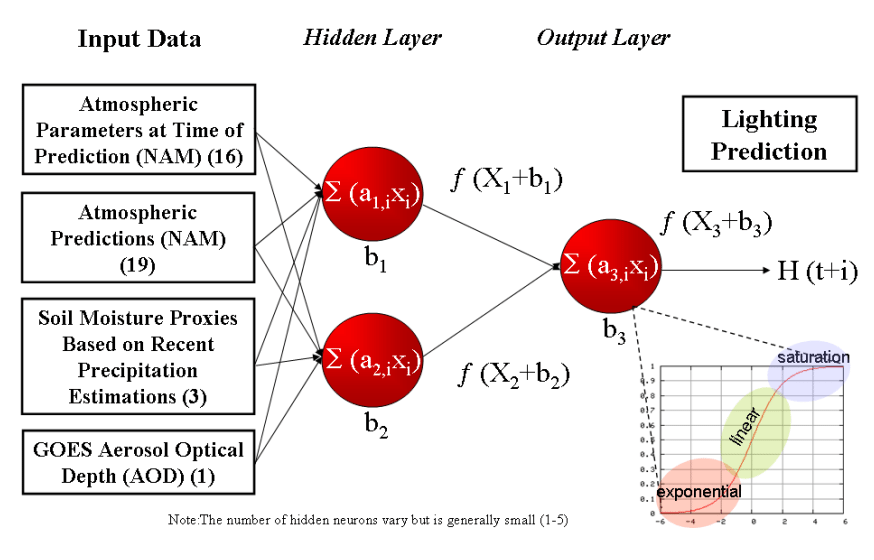
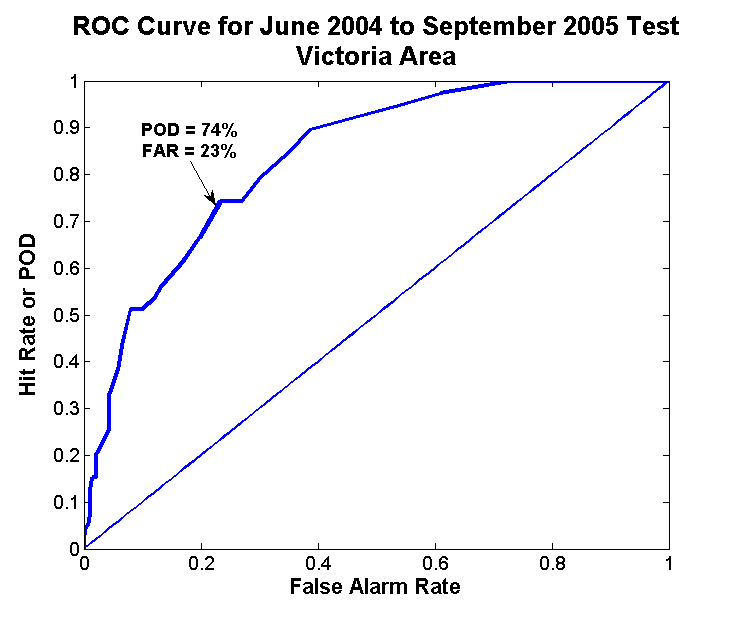
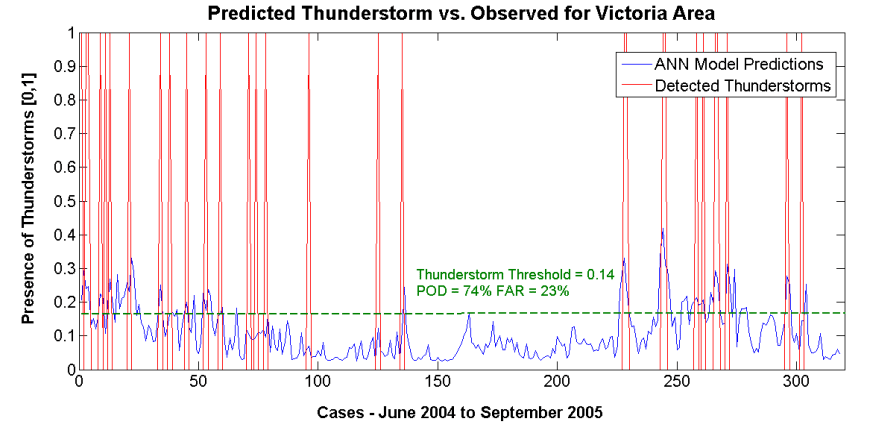
A feed-forward, supervised, multi-layer perceptron Artificial Neural Network (ANN) was developed to test the following hypothesis: An ANN can be developed to successfully forecast thunderstorm activity up to 24 hours in advance, and with a spatial accuracy of 20-km, wherein ANN inputs include selected output from (1) deterministic mesoscale Numerical Weather Prediction (NWP) models, and from (2) selected sub-grid scale data that contributes to convective initiation, or CI. The underlying logic of this hypothesis is that the NWP model output provides a forecast of whether the larger mesoscale environment is conducive to CI while the sub-grid scale data determines the extent to which convection could be triggered at a particular location. The ANN serves as a means to map the highly non-linear relationship between the foregoing inputs and thunderstorm occurrence; an ANN model to forecast thunderstorms would result.
For a more detailed update, you can access the text of a paper presented at the January 2008 American Meteorological Society meeting at this link: AMS PROCEEDINGS PAPER
Check out the presentation put together by our colleague meteorologist Bill Vessey from KIII TV. It gives an excellent introduction to the story: KIII TV News Story