Frequently Asked Questions
WHAT IS BEACH AND HABITAT RESTORATION?
Loss of habitat and beach erosion occurs by natural processes. In some cases these natural processes appear to be accelerated or intensified by development both direct and indirect. Restoration includes the protection of the existing state of a natural resource and in some cases may actually involve recreating or expanding the extent of an existing habitat (Shamrock Island) or beach (University Beach). Thus many communities take a proactive stance to protect natural resources such as wetlands, aquatic habitat and beaches from both natural and enhanced erosion. Protection of these natural resources can be approached in several ways depending on the resource at risk and the amount of funding available.
Locations & Management
Beaches:
Groins, Detached/Submerged Breakwaters, Nourishment, or Sediment Management
Wetlands and Aquatic Habitat:
Groins, Breakwaters, Nourishment, Vegetation, or Modify Area Navigation and Pedestrian Access
WHAT IS BEACH NOURISHMENT?
Beach nourishment involves placing new beach quality fill (sand) on a beach that is experiencing erosion. Often the entire beach is nourished but resource managers may also elect to place new sand only in hot spots (areas of accelerated erosion).
WHAT IS BEACH STABILIZATION?
The stability of a natural or artificial beach can be fortified in the following ways: Beach Nourishment (read above) and Coastal Structures.
Coastal Structures
Coastal structures are constructed in an effort to protect either the beach or other shore from erosion by regular and storm driven waves, currents and increased water levels. They are often built to protect the infrastructure (buildings, roads etc.) that exist behind beaches and other shores in developed areas. Not all communities and individuals agree with construction of coastal structures. The decision to protect and maintain coastal resources is often based on economic and environmental preservation issues that are site specific.
Coastal Structures (engineered and non-engineered) are site specific. That means that one coastal structure does not fit all situations or locations. The type, length, width, height, and composition are selected based on a comprehensive site assessment and often extensive data collection to define the local coastal processes (wind, waves, currents, tide, sediment transport).
Artificial COASTAL Structures
The following principle types of coastal structures have been employed to protect shore and habitat along the Texas Gulf Coast and inland bays and waterways:
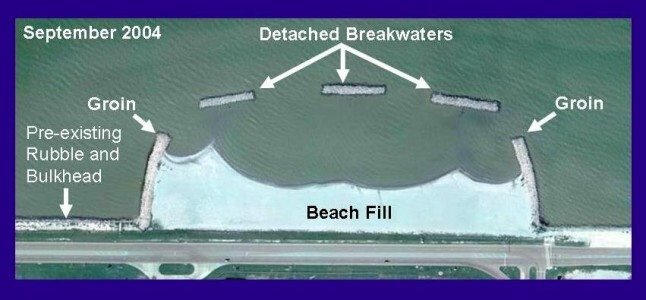
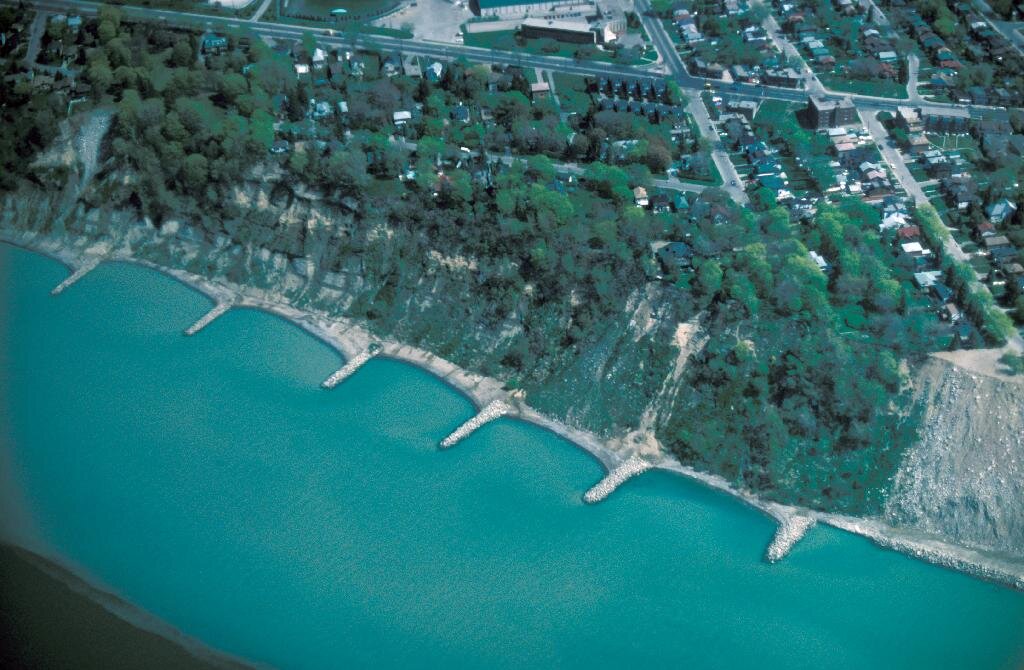
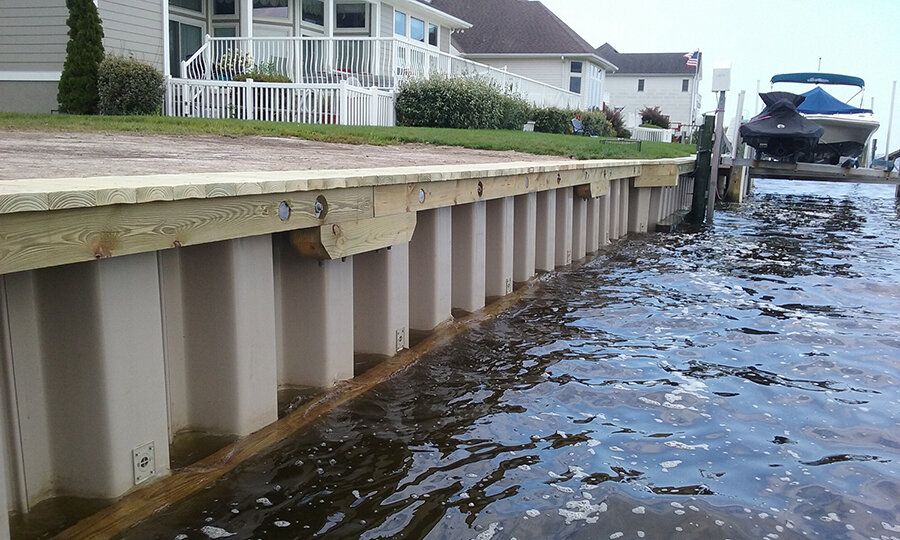
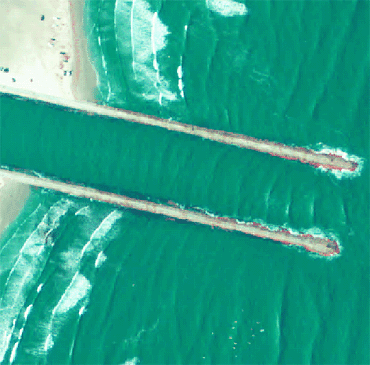
Groins – structures built perpendicular (at a right angle) to the shoreline. Groins can trap sand moving alongshore and also stop sand from leaving.
Breakwaters – structures that extend parallel to the shore at a defined offshore distance. Breakwaters trap sand behind them and also stop waves from breaking on the beach.
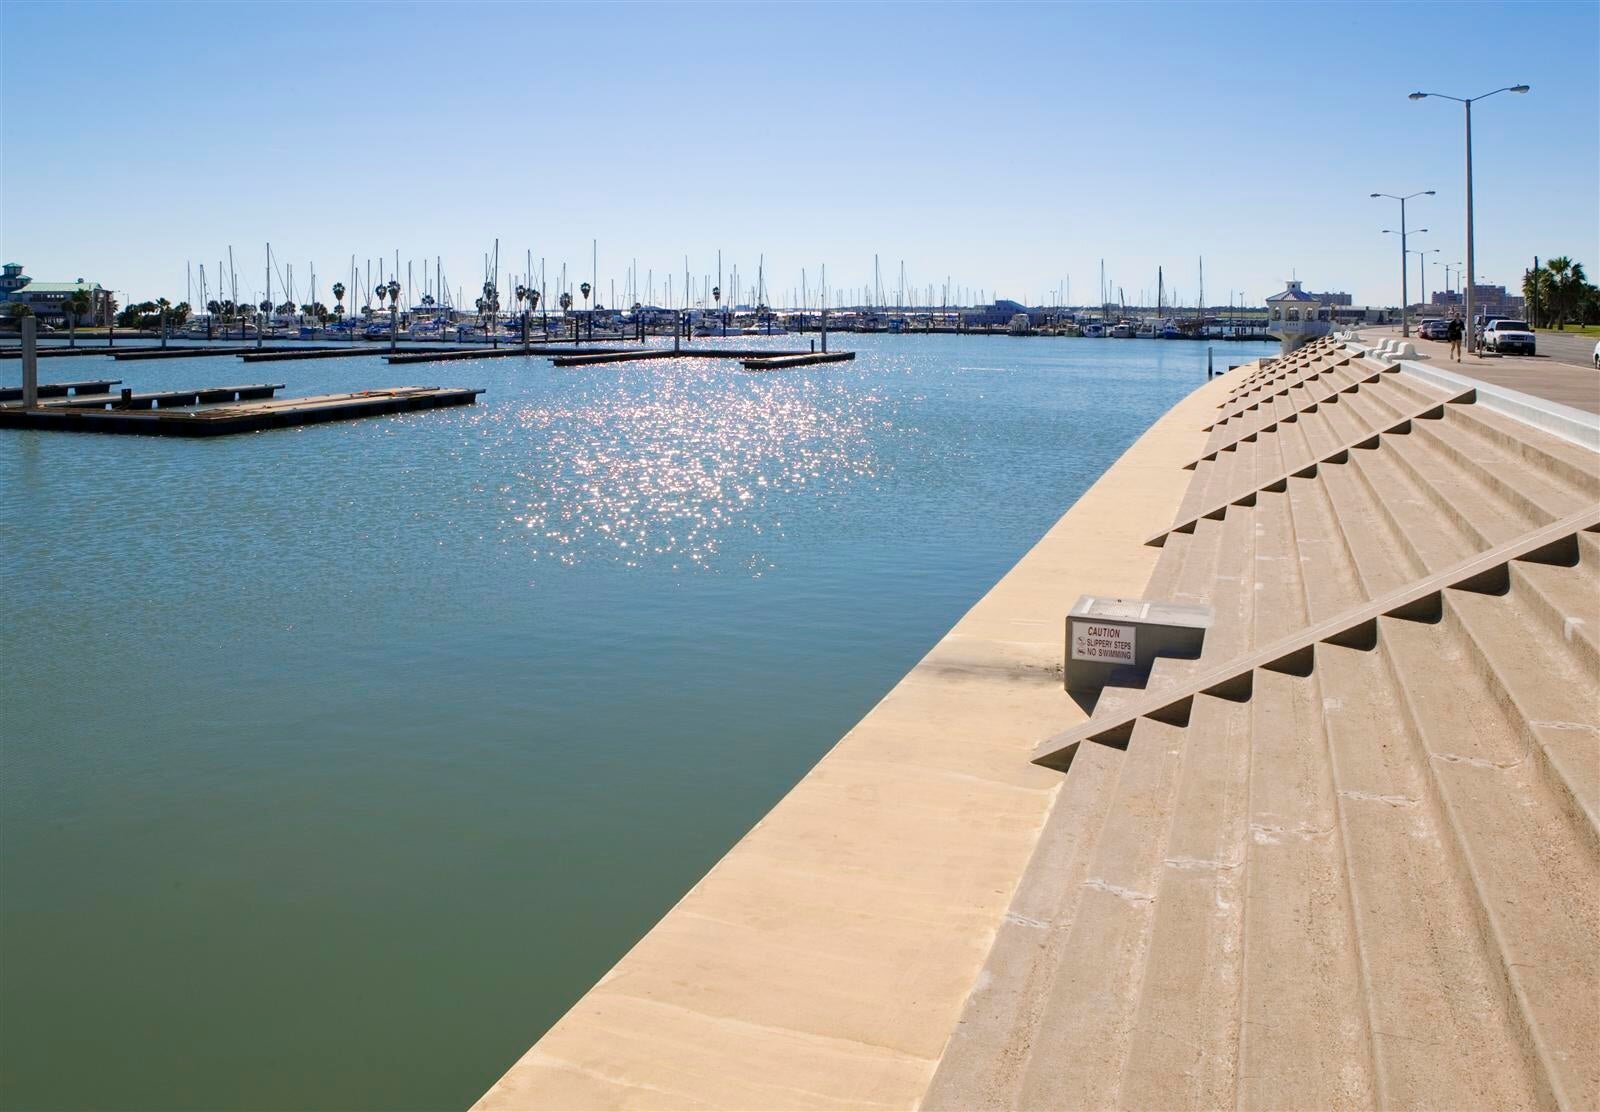
Seawall or Bulkhead– anthropogenic shoreline walls, breakwaters or encroachments, designed or positioned to break the force of waves or to hold back or protect the shoreline from erosion.
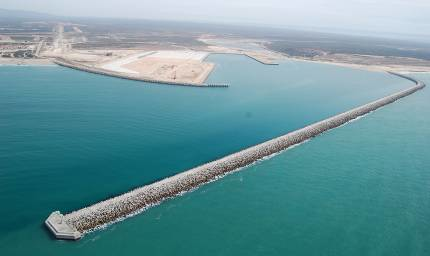
Jetties – coastal structures that are typically shore perpendicular and specifically placed to stabilize both natural and artificial channel intersection with larger water bodies.
Natural Coastal Structures
Reefs
function to break and disperse wave energy before it reaches the shore or beach. Thus reefs form a barrier that reduces erosion. Humans have designed breakwaters both submerged and subaerial in an effort to disperse wave forces.
Headlands
function to limit sediment loss alongshore by forming a lateral barrier to sediment transport. This reduces loss of sand from the protected beach. Humans have designed groins to perform a similar function
WHAT IS THE SHORELINE POSITION?
Shoreline position is the geographic location and elevation associated with the interface of the water and land at a given location. Often referred in non-technical terms as the water’s edge. The image above is a view as if one were a bird flying above the beach looking down.
How is it Measured?
The shoreline position at a given time can be determined from topographic surveys and interpreted from aerial photography.
What does it Mean?
The tide changes the position of the measurable shoreline daily in some locations multiple times per day. Thus if measured at high tide, the shoreline would be more landward than if measured at low tide. The beach width calculated could vary dramatically dependent on the time of day! Thus if aerial photography is applied then the exact time and relationship to tide level must be applied to adjust the shoreline position to a known datum so the data can be compared to shorelines measured in the future and past. To use these measurements for quantitative purposes such as determining changes in beach width, a reference datum must be selected. Such datums correspond to a known elevation such as Mean Sea Level.
WHAT IS A BEACH PROFILE SURVEY?
Image courtesy of Nicolas C. Kraus
A beach profile survey is a topographic and bathymetric survey of a beach and adjacent regions. The surveys are conducted along multiple shore perpendicular transects that typically initiate at the dune or other limiting landward feature (may be a wall or road) and extend across the beach and offshore to the depth of closure. In the case of University Beach the transects initiate at the Northern curb of Ocean Drive and extend offshore to an offshore distance of >900 ft and elevations of -5.4 NGVD 29.
Beach profile data provides valuable information describing the morphology, and key beach features such as the beach, sand bars and nearshore. By comparing recent data to past data scientists can calculate the volume of sand that is lost or gained over a specific time interval. This helps resource managers determine when to nourish a beach and how much sand to place.
Each Survey consists of two data sets (x,y,z or x,z). A data set in the format x,y,z consists of a geographic position such as Easting (x) and a Northing (y) as well as an elevation (z) relative to a known datum such as NGVD or water level (relative to a local tide station) is applied. Numerical models can then be applied to create terrain models and calculate volumetric change. Often Geographic Information Science (GIS) software is utilized for this task. The 2-D data is generated as a station offset file which provides a distance (x) from a known control point with an associated elevation (z) from the 3-D data set and consists of a distance from the control point and an elevation. The 2-D data is then graphed to provide a cross sectional view of the beach. This type of graphical representation shows features such as beach berm and sand bars and can be compared to previous data to calculate volumetric change and determine movement of key features.
WHAT IS AERIAL PHOTOGRAPHY?
Aerial Photographs are photographs that are taken from a specially equipped airplane at specific altitudes (heights) above the earth. Images from different dates can be compared to determine changes in such features as shoreline position and orientation, vegetation boundaries, and anthropogenic (human made) structures. Specialized imagery that has been rectified can be applied to calculate changes in elevation so that researchers can determine the volume of sediment that has been lost (erosion) or gained (accretion) in a region. This type of scientific use of photography is called photogrammetry.
Aerial Photographs were taken of University Beach seasonally as funding was available. These images allow temporal change to be interpreted both qualitatively (based on observations) and quantitatively (based on data analysis). These photographs compliment the topographic and hydrographic survey data by providing a view of the entire beach including the area adjacent to the beach cell. Thus, additional information on vegetation, shoreline shape, and regional accretion as well as wave refraction can be interpreted.
WHAT IS EROSION?
Erosion is a loss of material. In the case of beach erosion, sand is lost from a beach or other shoreline. Defining erosion along a stretch of shore is a bit tricky in that one beach’s erosion is often another beach’s accretion. In other words, sand lost on one beach may be eroded and transported downdrift to be deposited on another beach. Therefore, one must be specific about the area where the erosion is occurring when describing it. Additionally, erosion may be cyclic- material lost offshore during one season can be reclaimed onshore during a subsequent season or weather event.
WHAT IS ACCRETION?
Accretion is the addition of material to a beach or other shore. Typically this results in a wider beach or other habitat that extends further out into the water than it did previously.
WHAT AND WHERE IS CORPUS CHRISTI BAY?
Corpus Christi Bay is a moderate size bay that is approximately 19-km wide and 23-km long with a surface area of approximately 434 km2 (National Oceanic and Atmospheric Administration, NOAA, Chart 11309). The bay is shallow with the exception of dredged channels, which include the Corpus Christi Ship Channel and the Gulf Intracoastal Waterway (GIWW). Average bay depths are between 3 and 4 m. The nearshore periphery is composed of a shallow shelf with an average depth of 0.6-0.9 m.
Corpus Christi Bay is located along the south-central Texas Gulf Coast. A barrier-type estuary, Corpus Christi Bay is separated from the Gulf of Mexico by Mustang Island. The primary tidal inlet is Aransas Pass, which forms the northern terminus of Mustang Island. Ephemeral inlets include Fish Pass, Newport Pass, New Corpus Christi Pass, and Packery Channel. Corpus Christi Bay is bordered on the southeast by the Upper Laguna Madre and on the northeast by Redfish Bay. A smaller adjacent bay, Nueces Bay, lies to the northwest, and Oso Bay, another minor bay, is located in the southern quadrant of Corpus Christi Bay.
WHAT IS WATER QUALITY?
Water Quality can be interpreted in many ways. Qualitative observations include visual observations of the amount of debris floating or water clarity. The clarity of the water (how easily one can see through the water) can also be Quantitative described by measuring the amount of suspended solids (reduced clarity is often referred to as turbid or “murky” water), or by measuring the level of contamination either chemical or bacterial. The State is mandated by EPA to monitor the level of bacterial contamination of waters to determine if the level of bacteria in the water indicates that the water is acceptable for recreational use, i.e. swimming. If the levels of bacteria are high then the chance for illness due pathogenic organisms that are typically present under the same conditions as for the indicator organisms is increased and water use may not be recommended.
Water Quality is monitored at many beach locations along the Gulf of Mexico and Corpus Christi Bay. University Beach, McGee Beach and Corpus Christi Beach are part of such a monitoring program called the “Texas Beach Watch Program” which is facilitated by the TGLO. The water quality data available for download by CHRGIS is provided by the Texas Beach Watch Program.


